
Playwright & Prometheus. Send your metrics in real-time
What is a Playwright?
Playwright is a test automation library from Microsoft. It is designed to test web applications across different browsers, providing a unified API to automate browsers like Chromium, Firefox, and WebKit
Context
Our test automation framework is using playwright as a test library and allure testops as a reporter. But it collects only test metrics, like pass/fail scenarios, and shows attachments and stdin/out. But what happens with node.js while test scenarios have been executed? To answer this question we decided to collect deep metrics and export them to Prometheus because we already use it for showing k6 test metrics. After collecting these metrics to Prometheus it automatically bypasses Grafana. With Grafana we built some infographics about run.
What is Prometheus?
Prometheus is a system monitoring and alerting toolkit. Prometheus is designed to collect metrics from various systems, store them, and enable querying and analysis of those metrics.
What was implemented?
We implemented a playwright reporter that pushes metrics directly from tests (or reporters) into the Prometheus instance.
How you sends metrics?
TThe initial idea was to adopt the sources from prometheus-remote-write.
Unfortunately, I have a few problems with it, so I decided to use the package, instead of adopting the source code.
We use prometheus-remote-write package to achieve the goal.
Technical details
helper.ts
In helper.ts we export classes: Counter and Gauge.
Counter - is a structure which can be only increased
Gauge - same as Counter but can decrease and set the value
abstract class Metric {
  protected series: PrometheusWriterTimeseries
  _getSeries() {
    return this.series
  }
}

export class Counter extends Metric {
  protected counter: number = 0
  inc(value) {
    this.counter += value
  }
}

export class Gauge extends Counter {
  set(value) {
    this.counter = value
  }
  dec(value) {
    this.counter -= value
  }
}index.ts file uses these metrics to collect on its own it's side
import { Counter, Gauge } from './helper'

import { Reporter } from '@playwright/test'

export { Counter, Gauge }

export default class PrometheusReporter implements Reporter {
  private test = new Counter(
    {
      name: 'test',
    },
    1,
  ) // always static, let it be 1
  constructor(options) {
    this.options = options
  }
  private async send(timeseries: Timeseries | Timeseries[]) {
    // send metrics to prometheus using options
  }
  async onTestEnd(test, result) {
    this.test
      .labels({
        title: test.title,
        id: test.id,
        // ...etc
      })
      .inc()

    await this.send(this.test._getSeries())

    this.test.reset() // new test, new counter
  }
}How to start?
Before installing the package you need to configure Prometheus.
- Enable remote-write feature. See what
prometheus.ymlwe use. - Start the docker container(or restart the remote instance) with the feature:
--enable-feature=remote-write-receiver. See example frompackage.json
Now you are ready to move further
Install the package
npm i playwright-prometheus-remote-write-reporter # npm
yarn add playwright-prometheus-remote-write-reporter # yarn
pnpm add playwright-prometheus-remote-write-reporter # pnpm
bun a playwright-prometheus-remote-write-reporter # bun
What metrics are collected by default?
By default, we collect node js internals stats and playwright-exposed metrics, like a project, test, annotations, test duration, etc.
Full list of collected metrics you may found here
Enable reporter
in your playwight.config.ts add next line
export default defineConfig({
  // ...
  reporter: [
    [
      'playwright-prometheus-remote-write-reporter',
      {
        // options object
      },
    ],
  ],
  // ...
})Use custom metrics
Apart from built-in metrics. We export Counter and Gauge classes to make custom metrics exportable
import { test } from '@playwright/test'
import { Counter } from 'playwright-prometheus-remote-write-reporter'

const gotoCounter = new Counter(
  {
    name: 'url',
  },
  0,
)

test('example test', async ({ page }) => {
  await page.goto('http://example.com')
  gotoCounter
    .labels({
      url: 'http://example.com',
    })
    .inc() // 1

  await page.goto('https://playwright.dev')
  gotoCounter
    .labels({
      url: 'https://playwright.dev',
    })
    .inc() // 2
})

test.afterEach(() => {
  gotoCounter.collect() // send to prometheus
  gotoCounter.reset() // reset counter after each test
})Result
As you can see - now your metrics are exportable and ready to display in Grafana.
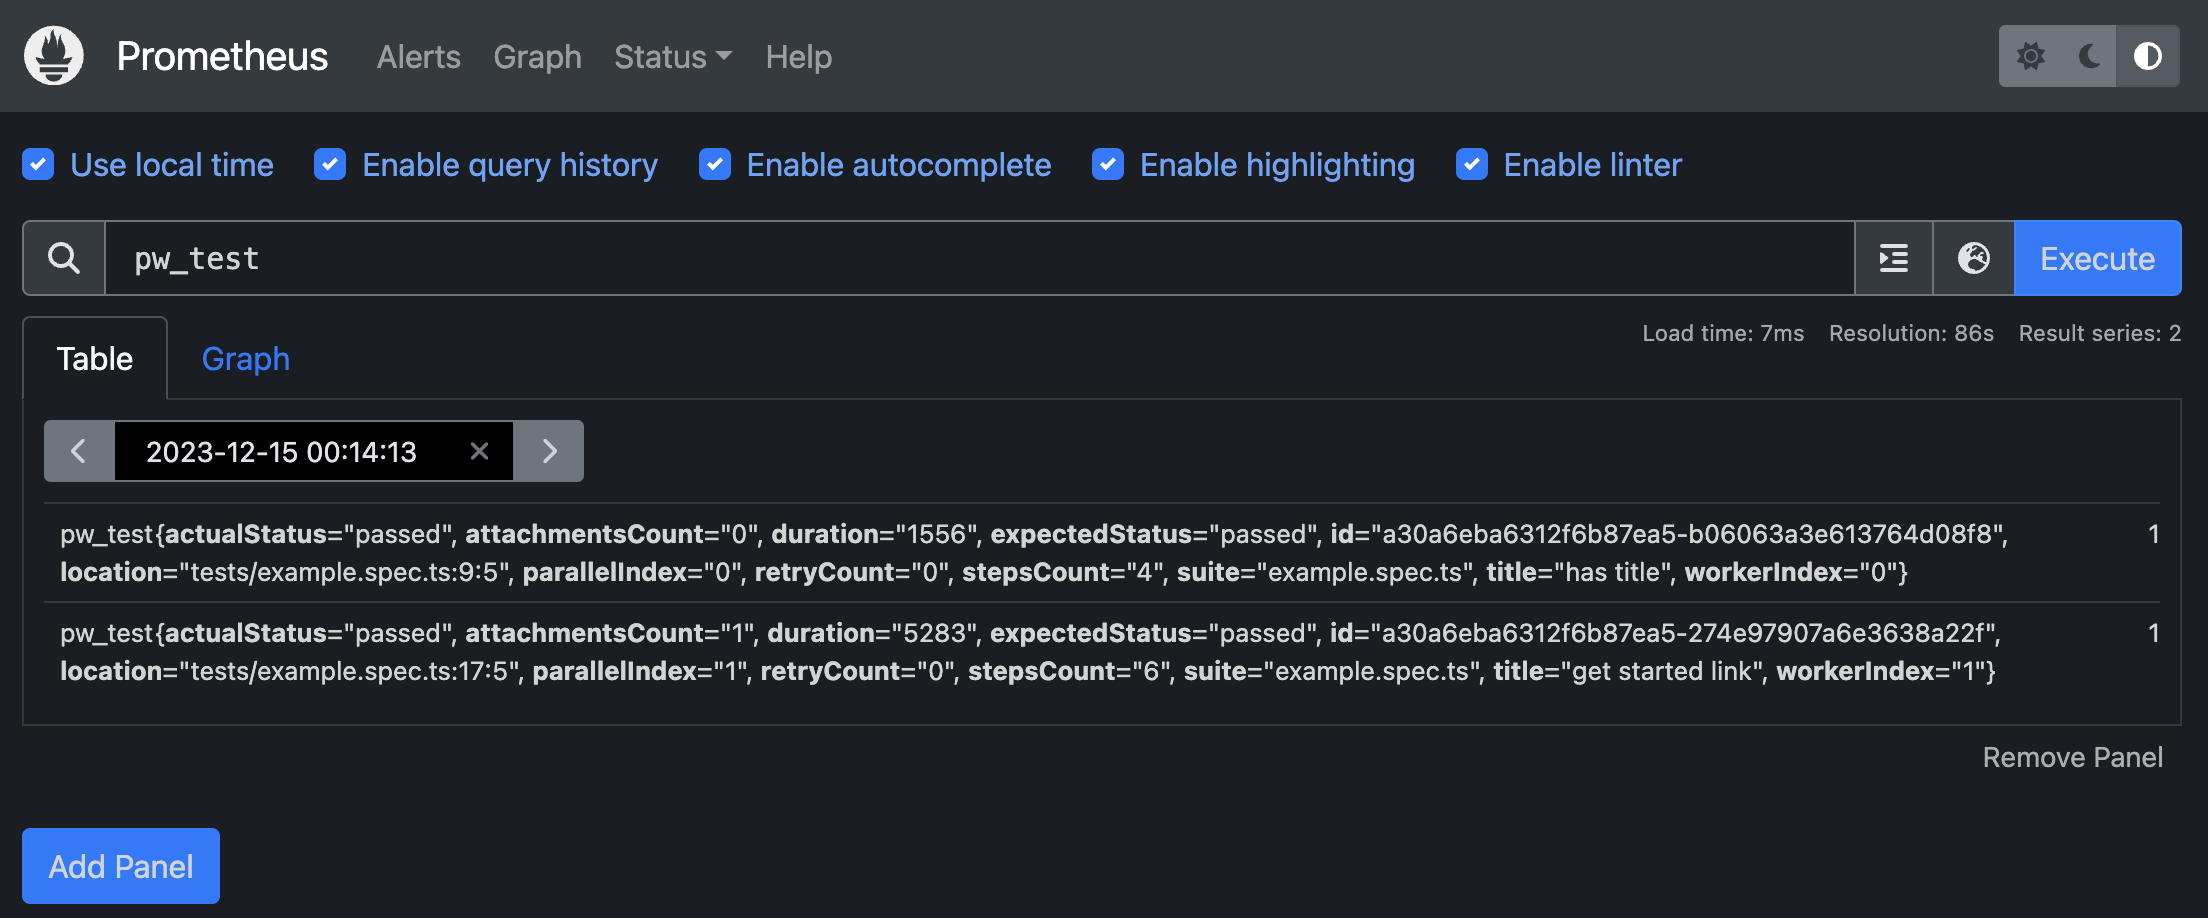
Image 1. Result from package example
Note 1: Unfortunately, in my machine grafana cannot establish the connection to Prometheus. So you might see only the local Prometheus instance.
Note 2: During project limitation, I cannot show how it looks like in our self-hosted grafana
Happy metric collection!
Links
- [1]: https://github.com/vitalics/playwright-prometheus-remote-write-reporter - reporter
- [2]: https://www.npmjs.com/package/playwright-prometheus-remote-write-reporter - npm library
- [3]: https://playwright.dev- playwright
- [4]: https://qameta.io - allure testops
- [5]: https://prometheus.io - prometheus
- [6]: https://grafana.com - grafana
- [7]: https://github.com/huksley/prometheus-remote-write - prometheus remote write node.js library